Matplotlib - 单位处理
什么是单位处理?
在 Matplotlib 库中,单位处理指的是库管理并解释不同类型单位以准确绘制数据的能力。Matplotlib 允许用户指定并使用各种单位来定义和显示图表上的数据,这些单位可能与长度、时间、角度或其他物理量相关。
Matplotlib 中单位处理的关键方面
以下是 matplotlib 库中单位处理的关键方面。
支持多种单位
Matplotlib 支持多种单位,如 pixels、inches、centimeters、points、figure size 的分数等。这种灵活性允许用户使用自己选择的单位来定义图表元素,如位置、大小和间距。
转换和变换
Matplotlib 无缝处理单位转换和变换。它在绘图或指定属性(如大小、位置或尺寸)时,能够在不同单位之间自动进行转换。
单位感知函数
许多 Matplotlib 函数和方法都是 unit-aware 的,这意味着它们接受不同单位的参数或论据,并内部管理绘图所需的转换。
单位处理的函数和技术
单位处理有少数技术和函数可用。
自动转换
Matplotlib 会自动处理绘图数据的单位转换。当使用 plot() function 或其他绘图函数时,该库会根据所选坐标系统将数据单位转换为显示单位。
这种自动转换简化了在 Matplotlib 中绘图的过程,无需用户进行显式的转换步骤即可处理不同单位之间的转换。以下是一个演示单位处理中自动转换的示例。
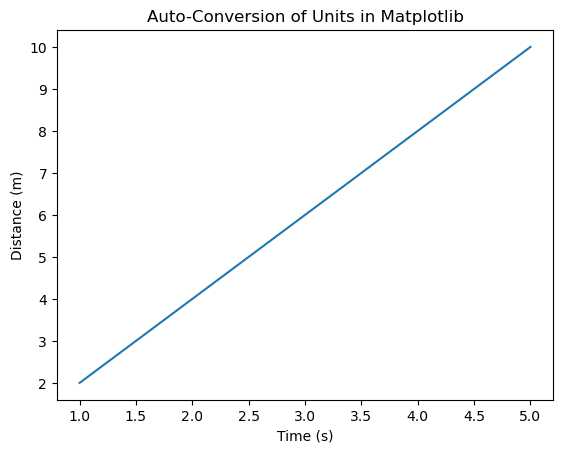
示例 - 自动单位转换
import matplotlib.pyplot as plt

# Sample data in different units
time_seconds = [1, 2, 3, 4, 5]  # 时间(秒)
distance_meters = [2, 4, 6, 8, 10]  # 距离(米)
plt.plot(time_seconds, distance_meters)  # Matplotlib handles unit conversion
plt.xlabel('Time (s)')
plt.ylabel('Distance (m)')
plt.title('Auto-Conversion of Units in Matplotlib')
plt.show()
输出
轴标签
在轴标签中,我们使用 xlabel() 和 ylabel() 函数分别为 x 轴和 y 轴添加标签。这些函数允许我们在轴标签中指定单位。
我们可以相应调整标签以匹配所绘图数据的单位。这种做法有助于为查看图表的任何人提供绘图数据的上下文和清晰度。以下是一个使用 Matplotlib 为轴添加单位标签的示例。
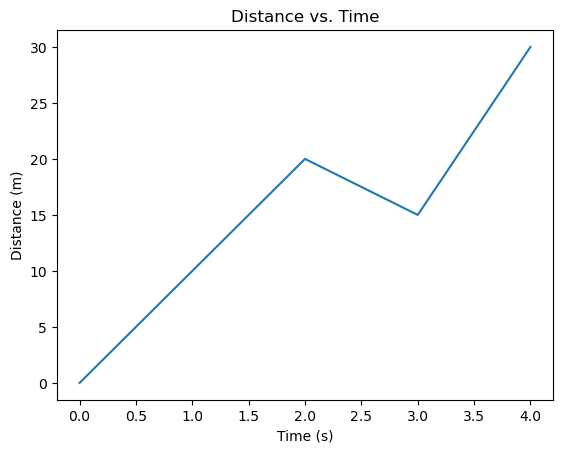
示例 - 轴标签
import matplotlib.pyplot as plt

# Sample data
time = [0, 1, 2, 3, 4]  # Time in seconds
distance = [0, 10, 20, 15, 30]  # Distance in meters

# Creating a plot
plt.plot(time, distance)

# Labeling axes with units
plt.xlabel('Time (s)')
plt.ylabel('Distance (m)')
plt.title('Distance vs. Time')
plt.show()
输出
自定义单位
为了更明确的控制,可以使用轴的 set_units() 方法,如 ax.xaxis.set_units() 和 ax.yaxis.set_units(),来显式设置 x 轴和 y 轴的单位。
这种自定义轴单位处理确保图表使用特定单位显示数据,例如时间使用小时、距离使用公里等,并相应地为轴添加标签,从而为可视化提供上下文和清晰度。以下是一个演示 Matplotlib 中自定义轴单位处理的示例。
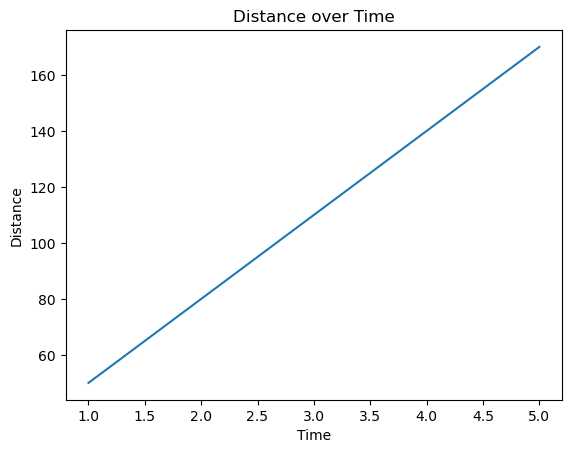
示例 - 自定义单位的使用
import matplotlib.pyplot as plt

# Sample data
time_hours = [1, 2, 3, 4, 5]  # Time in hours
distance_km = [50, 80, 110, 140, 170]  # Distance in kilometers
fig, ax = plt.subplots()

# Plotting the data
ax.plot(time_hours, distance_km)

# Customizing x-axis and y-axis units
ax.xaxis.set_units('hours')  # Set x-axis units to hours
ax.yaxis.set_units('km')     # Set y-axis units to kilometers

# Labeling axes with units
ax.set_xlabel('Time')
ax.set_ylabel('Distance')
ax.set_title('Distance over Time')
plt.show()
输出
单位转换
在 plt.gca() 中的函数如 convert_xunits() 和 convert_yunits() 可以将数据单位转换为显示单位。以下是一个演示 Matplotlib 中单位处理单位转换的示例。
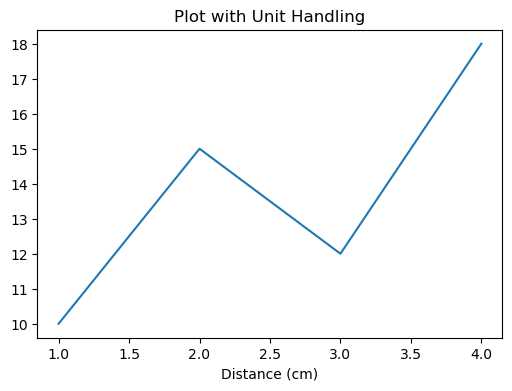
示例 - 单位转换
import matplotlib.pyplot as plt

# Specify figure size in inches
plt.figure(figsize=(6, 4))  # Width: 6 inches, Height: 4 inches

# Set x-axis label with different units
plt.xlabel('Distance (cm)')  # Using centimeters as units

# Plotting data with specific units
x = [1, 2, 3, 4]
y = [10, 15, 12, 18]
plt.plot(x, y)
plt.title('Plot with Unit Handling')
plt.show()
输出
单位处理的使用场景
测量一致性 − 确保标签、注释和图表元素使用一致的单位,以提供清晰度。
与维度无关的绘图 − 无论单位类型如何(如长度、时间等),Matplotlib 都能处理转换和适当缩放来绘图数据。
自定义灵活性 − 允许用户使用首选单位定义图表属性,从而更好地控制可视化。