Matplotlib - 动画
动画 是一种视觉技术,通过一系列单独的帧创建运动图像。每帧代表时间上的一个特定时刻,当连续快速播放时,它们会产生运动的错觉。例如,常见的动画对象示例是 GIF。这里是一个例子 −

动画的流行文件格式包括 GIF、APNG(Animated Portable Network Graphics)、mkv、mp4 等。
Matplotlib 中的动画
Matplotlib 提供了一个专用的模块来创建动画。在这种情况下,动画是一系列帧,每帧都与 Figure 上的一个图表相关联。
为了将动画功能集成到我们的工作环境中,我们可以使用以下命令导入专用模块 −
import matplotlib.animation as animation
创建动画
在 Matplotlib 中创建动画可以通过两种不同的方法实现。matplotlib.animation 模块为此目的提供了两个主要 class −
- FuncAnimation
- ArtistAnimation
FuncAnimation class
使用 FuncAnimation class 的方法是一种高效的方式,通过为每一帧修改图表的数据来创建动画。它允许我们通过传递一个用户定义的函数来创建动画,该函数迭代修改图表的数据。这个 class 涉及为初始帧生成数据,然后为每个后续帧修改这些数据。
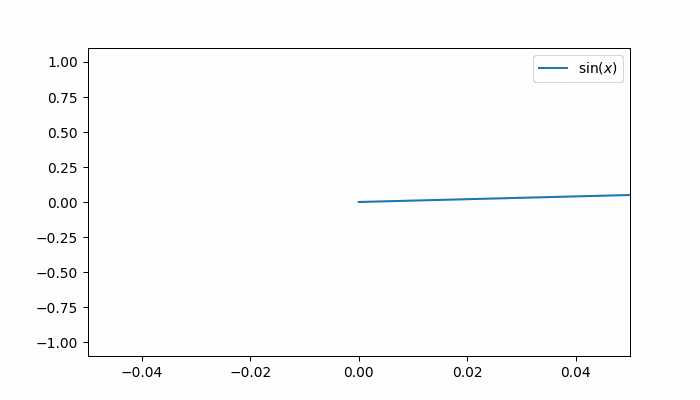
示例 - FuncAnimation Class 的用法
此示例演示了使用 FuncAnimation class 来为正弦波图表创建动画,展示物体的运动。它还使用 Matplotlib animation 更新 X 轴值。
import matplotlib.pyplot as plt
import numpy as np
import matplotlib.animation as animation

# 创建 figure 和 axis
fig, ax = plt.subplots(figsize=(7, 4))

# 生成 x 值
x = np.arange(0, 2*np.pi, 0.01)

# 绘制初始正弦曲线
line, = ax.plot(x, np.sin(x))
ax.legend([r'$\sin(x)$'])

# 更新动画每一帧图表的函数
def update(frame):
   line.set_ydata(np.sin(x + frame / 50))
   ax.set_xlim(left=0, right=frame)
   return line

# 创建 FuncAnimation 对象
ani = animation.FuncAnimation(fig=fig, func=update, frames=40, interval=30)

# 显示输出
plt.show()
输出
上述示例产生以下输出 −
示例 - 动画 3D 曲面图
这是一个使用 FuncAnimation class 创建动画 3D 曲面图的另一个示例。
import numpy as np
import matplotlib.pyplot as plt
import matplotlib.animation as animation

# 生成数据
N = 50
fps = 250
frn = 75
x = np.linspace(-2, 2, N + 1)
x, y = np.meshgrid(x, x)
zarray = np.zeros((N + 1, N + 1, frn))
f = lambda x, y, sig: 1 / np.sqrt(sig) * np.exp(-(x ** 2 + y ** 2) / sig ** 2)

# 创建数据数组
for i in range(frn):
   zarray[:, :, i] = f(x, y, 1.5 + np.sin(i * 2 * np.pi / frn))

# 更新图表函数
def change_plot(frame_number, zarray, plot):
   plot[0].remove()
   plot[0] = ax.plot_surface(x, y, zarray[:, :, frame_number], cmap="afmhot_r")

# 创建 figure 和 subplot
fig = plt.figure(figsize=(7, 4))
ax = fig.add_subplot(111, projection='3d')

# 初始图表
plot = [ax.plot_surface(x, y, zarray[:, :, 0], color='0.75', rstride=1, cstride=1)]

# 设置轴限制
ax.set_zlim(0, 1.1)

# 动画
ani = animation.FuncAnimation(fig, change_plot, frn, fargs=(zarray, plot), interval=1000 / fps)

# 关闭轴和网格
ax.axis('off')
ax.grid(False)

# 显示图表
plt.show()
输出
上述示例产生以下输出 −
ArtistAnimation
ArtistAnimation 是一种灵活的方法,适用于需要按序列动画化不同 artist 的场景。这种方法涉及生成一个 artist 列表(可迭代对象),以便在动画的每一帧中绘制它们。
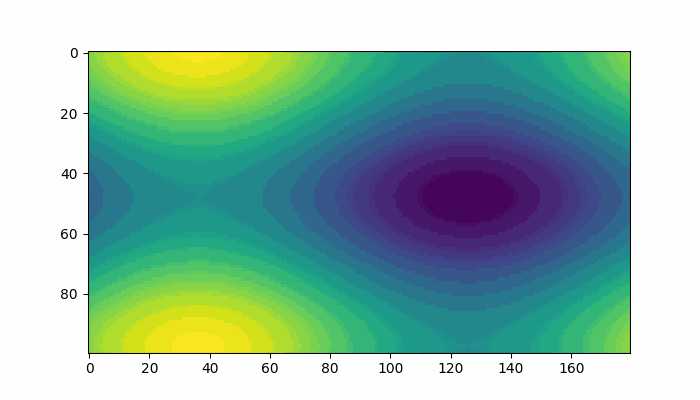
示例 - ArtistAnimation Class 的用法
此示例演示了使用 ArtistAnimation class 创建动画。
import matplotlib.pyplot as plt
import numpy as np
import matplotlib.animation as animation

# 创建 figure 和 axis
fig, ax = plt.subplots(figsize=(7,4))

# 定义函数
def f(x, y):
   return np.sin(x) + np.cos(y)

# 为函数生成 x 和 y 值
x = np.linspace(0, 2 * np.pi, 180)
y = np.linspace(0, 2 * np.pi, 100).reshape(-1, 1)

# ims 是一个列表的列表,每一行是当前帧中要绘制的 artist 列表
ims = []

# 为动画生成帧
for i in range(60):
   x += np.pi / 10
   y += np.pi / 30
   im = ax.imshow(f(x, y), animated=True)
   if i == 0:
      ax.imshow(f(x, y))  # 首先显示一个初始图像
   ims.append([im])

# 使用指定的 interval、blit 和 repeat_delay 创建 ArtistAnimation
ani = animation.ArtistAnimation(fig, ims, interval=50, blit=True, repeat_delay=1000)
# 显示动画
plt.show()
输出
上述代码生成以下结果 −
保存动画
可以使用不同的多媒体写入器将动画对象保存到磁盘上,例如 Pillow、ffmpeg 和 imagemagick。不过,需要注意的是,并非所有视频格式都得到每个写入器的支持。有四种主要的写入器类型:
- PillowWriter
- HTMLWriter
- Pipe-based writers
- File-based writers
PillowWriter
它使用 Pillow 库将动画保存为各种格式,例如 GIF、APNG 和 WebP。
Example - Usage of PillowWriter Class
以下示例演示了如何使用 PillowWriter 对散点图进行动画化并将其保存为 GIF。
import matplotlib.pyplot as plt
import matplotlib.animation as animation
import numpy as np

# 生成数据
steps = 50
nodes = 100
positions = []
solutions = []

for i in range(steps):
   positions.append(np.random.rand(2, nodes))
   solutions.append(np.random.random(nodes))

# 创建图形和轴
fig, ax = plt.subplots(figsize=(7, 4))
marker_size = 50

# 更新动画每一帧图形的函数
def animate(i):
   fig.clear()
   ax = fig.add_subplot(111, aspect='equal', autoscale_on=False, xlim=(0, 1), ylim=(0, 1))
   ax.set_xlim(0, 1)
   ax.set_ylim(0, 1)
   s = ax.scatter(positions[i][0], positions[i][1], s=marker_size, c=solutions[i], cmap="RdBu_r", marker="o", edgecolor='black')

plt.grid(None)

# 创建 FuncAnimation 对象
ani = animation.FuncAnimation(fig, animate, interval=100, frames=range(steps))

# 使用 PillowWriter 将动画保存为 GIF
ani.save('animation.gif', writer='pillow')
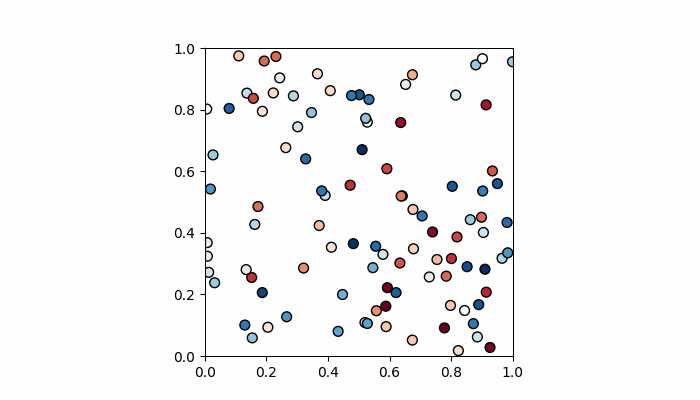
如果您访问输出保存的文件夹,您将看到以下 GIF 文件 −
Output
HTMLWriter
HTMLWriter 用于创建基于 JavaScript 的动画,支持 HTML 和 PNG 格式。此写入器适用于在网页中嵌入动画。
Pipe-based writers
这些写入器使用外部工具如 FFMpegWriter 和 ImageMagickWriter 来创建动画。它们支持各种视频格式,帧通过管道传输到该工具,该工具将它们拼接在一起以创建动画。
File-based writers
基于文件的写入器(FFMpegFileWriter 和 ImageMagickFileWriter)速度稍慢,但具有在创建最终动画之前保存每一帧的优势。
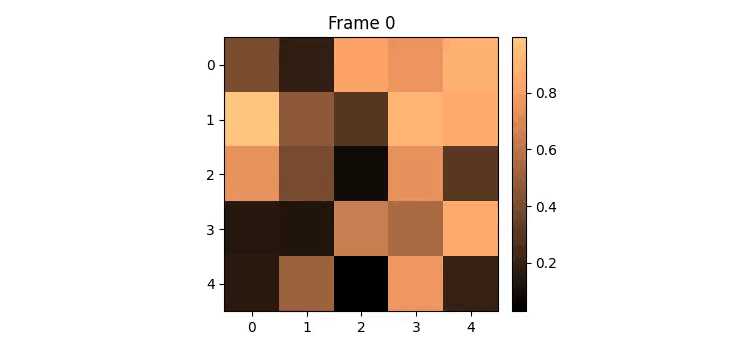
Example - Enabling ffmpeg
以下示例展示了如何为 matplotlib.animation 正确启用 ffmpeg。此处创建了一个带有动画图像矩阵和动画 colorbar 的图表。
import numpy as np
import matplotlib.pyplot as plt
import matplotlib.animation as animation
from mpl_toolkits.axes_grid1 import make_axes_locatable

plt.rcParams["figure.figsize"] = [7.50, 3.50]
plt.rcParams["figure.autolayout"] = True
plt.rcParams['animation.ffmpeg_path'] = 'ffmpeg'

fig = plt.figure()
ax = fig.add_subplot(111)
div = make_axes_locatable(ax)
cax = div.append_axes('right', '5%', '5%')
data = np.random.rand(5, 5)
im = ax.imshow(data)
cb = fig.colorbar(im, cax=cax)
tx = ax.set_title('Frame 0')

cmap = ["copper", 'RdBu_r', 'Oranges', 'cividis', 'hot', 'plasma']

def animate(i):
   cax.cla()
   data = np.random.rand(5, 5)
   im = ax.imshow(data, cmap=cmap[i%len(cmap)])
   fig.colorbar(im, cax=cax)
   tx.set_text('Frame {0}'.format(i))

ani = animation.FuncAnimation(fig, animate, frames=10)
FFwriter = animation.FFMpegWriter()
ani.save('plot.mp4', writer=FFwriter)
Output
执行上述代码后,您将得到以下输出 −