Matplotlib - Polygon Selector
介绍
Matplotlib 没有专用的 Polygon Selector 小部件。然而,Matplotlib 提供了处理鼠标事件的机制,我们可以使用这些事件处理功能来实现自定义的多边形选择功能。
Matplotlib 允许我们捕获鼠标事件,例如按钮点击、鼠标移动和释放。我们可以利用这些事件来实现一个多边形选择工具,用户可以交互式地在所需数据点周围绘制多边形。
关键概念
以下是多边形选择器小部件的关键概念。
Matplotlib 中的事件处理
Matplotlib 提供了一个灵活的事件处理系统,允许我们捕获用户与图表的交互。常见事件包括鼠标点击、按键和移动。
Path 类
matplotlib.path 模块中的 Path 类表示一系列连接的线段和曲线段,可用于定义诸如多边形等形状。我们将使用它来定义多边形并检查点是否在选定多边形内部。
使用场景和扩展
以下是多边形选择器小部件的使用场景和扩展。
- Region Selection − 自定义 Polygon Selector 可用于定义并选择图表中的特定感兴趣区域,允许用户聚焦于数据特定区域。
- Data Filtering − 选定多边形的点可用于过滤和分析绘图数据集中的特定子集。
- Integration with Callbacks − 我们可以通过集成回调函数来扩展功能,这些函数响应多边形选择,从而允许基于选定区域执行自定义操作或分析。
- Dynamic Visualization − 实现动态可视化更新,例如高亮多边形内的点,可以提升用户体验。
自定义
我们可以根据特定需求增强和自定义多边形选择器。例如,我们可以添加清除当前多边形的功能够根据选定区域动态更新图表,或将其集成到更大的交互式应用程序中。
实现步骤
现在让我们逐步了解如何在 Matplotlib 中创建一个自定义多边形选择器的基本示例。
导入必要的库
首先,我们需要导入 Matplotlib 和 NumPy 库,用于绘图和数组操作。
import matplotlib.pyplot as plt
import numpy as np
定义多边形选择器类
导入必要的库后,我们需要创建一个类来处理鼠标事件,并允许用户绘制多边形。
class PolygonSelector:
   def __init__(self, ax):
      self.ax = ax
      self.polygon = None
      self.vertices = []
      self.cid_press = ax.figure.canvas.mpl_connect('button_press_event', self.on_press)
      self.cid_release = ax.figure.canvas.mpl_connect('button_release_event', self.on_release)
      self.cid_motion = ax.figure.canvas.mpl_connect('motion_notify_event', self.on_motion)
定义事件回调
我们需要定义事件回调来实现处理鼠标按下、释放和移动事件的方法。
def on_press(self, event):
   if event.inaxes != self.ax:
      return

   if event.button == 1:  # 左键鼠标按钮
      if self.polygon is None:
         self.polygon = plt.Polygon([event.xdata, event.ydata], closed=False, fill=None, edgecolor='r')
         self.ax.add_patch(self.polygon)
         self.vertices.append((event.xdata, event.ydata))
   else:
      self.vertices.append((event.xdata, event.ydata))

def on_release(self, event):
   if event.inaxes != self.ax:
      return

   if event.button == 1:  # 左键鼠标按钮
      if len(self.vertices) > 2:
         self.vertices.append(self.vertices[0])  # 闭合多边形
         self.polygon.set_xy(np.array(self.vertices))
         plt.draw()

   def on_motion(self, event):
      if event.inaxes != self.ax:
         return

   if event.button == 1 and self.polygon is not None:
      self.vertices[-1] = (event.xdata, event.ydata)
      self.polygon.set_xy(np.array(self.vertices))
      plt.draw()
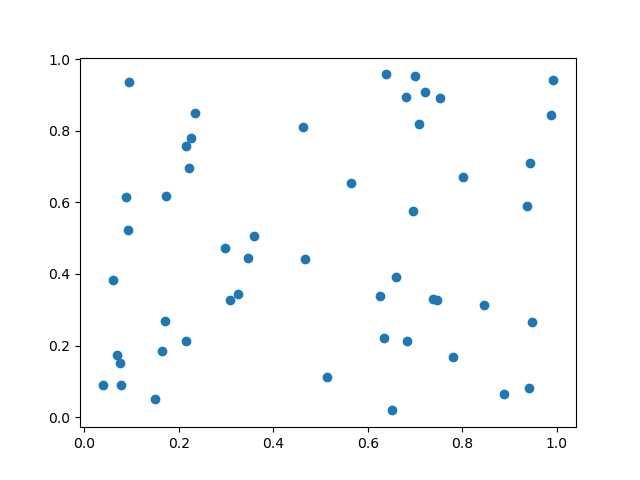
创建图表
接下来,我们需要生成示例数据并为这些数据创建图表。
x = np.random.rand(50)
y = np.random.rand(50)
fig, ax = plt.subplots()
ax.scatter(x, y)
初始化多边形选择器并显示图表
现在使用图表的 axes 实例化 PolygonSelector 类,然后显示图表。
polygon_selector = PolygonSelector(ax)
plt.show()
现在让我们将上述所有步骤组合在一起。
输出
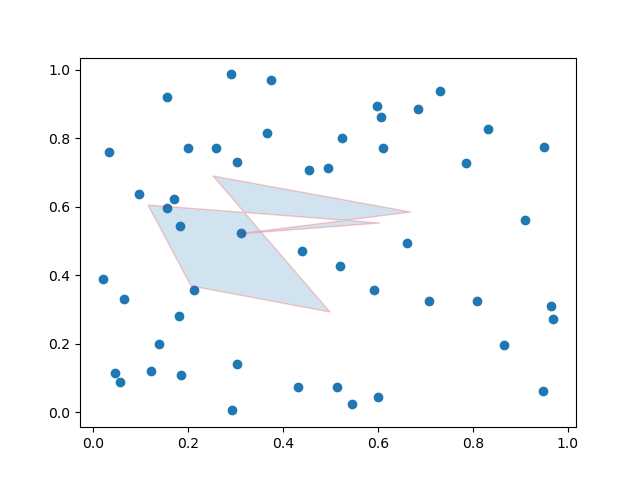
示例 - 多边形选择器的使用
import matplotlib.pyplot as plt
from matplotlib.patches import Polygon
from matplotlib.backend_bases import PickEvent
import numpy as np

class PolygonSelector:
   def __init__(self, ax):
      self.ax = ax
      self.points = []
      self.polygon = None
      self.cid_click = ax.figure.canvas.mpl_connect('button_press_event', self.on_click)
      self.cid_key = ax.figure.canvas.mpl_connect('key_press_event', self.on_key_press)

   def on_click(self, event):
      if event.inaxes == self.ax:
         if event.button == 1:  # 左键鼠标按钮
            self.points.append((event.xdata, event.ydata))
            self.update_polygon()

   def on_key_press(self, event):
      if event.key == 'enter':
         print("Polygon points:", self.points)
         self.reset_polygon()

   def update_polygon(self):
      if self.polygon:
         self.polygon.remove()
      if len(self.points) > 2:
         self.polygon = Polygon(self.points, edgecolor='red', alpha=0.2, closed=True)
         self.ax.add_patch(self.polygon)
         self.ax.figure.canvas.draw()

   def reset_polygon(self):
      self.points = []
      if self.polygon:
         self.polygon.remove()
         self.ax.figure.canvas.draw()

# 使用随机数据创建散点图
np.random.seed(42)
x_data = np.random.rand(50)
y_data = np.random.rand(50)
fig, ax = plt.subplots()
ax.scatter(x_data, y_data)
# 初始化 PolygonSelector
polygon_selector = PolygonSelector(ax)
plt.show()
输出
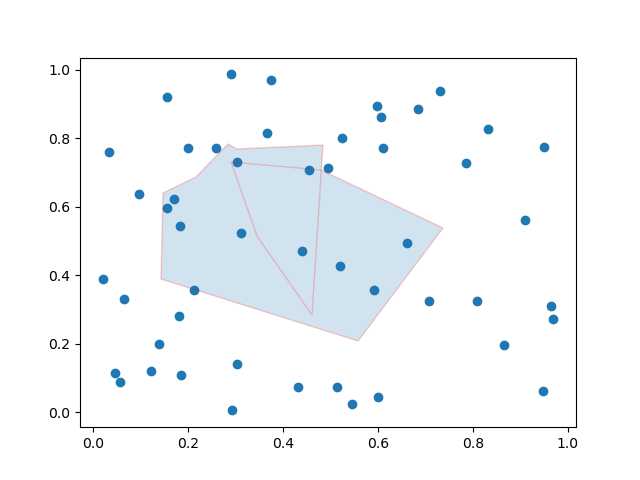
示例 - 多边形选择器
这里是另一个在 matplotlib 图表上创建多边形选择器的示例。
import matplotlib.pyplot as plt
from matplotlib.patches import Polygon
from matplotlib.backend_bases import PickEvent
import numpy as np
class PolygonSelector:
   def __init__(self, ax):
      self.ax = ax
      self.points = []
      self.polygon = None
      self.highlighted_points = None
      self.cid_click = ax.figure.canvas.mpl_connect('button_press_event', self.on_click)
      self.cid_key = ax.figure.canvas.mpl_connect('key_press_event', self.on_key_press)
   def on_click(self, event):
      if event.inaxes == self.ax:
         if event.button == 1:  # 左键鼠标按钮
            self.points.append((event.xdata, event.ydata))
            self.update_polygon()
   def on_key_press(self, event):
      if event.key == 'enter':
         self.highlight_points_inside_polygon()
         self.reset_polygon()
   def update_polygon(self):
      if self.polygon:
         self.polygon.remove()
         if len(self.points) > 2:
            self.polygon = Polygon(self.points, edgecolor='red', alpha=0.2, closed=True)
            self.ax.add_patch(self.polygon)
            self.ax.figure.canvas.draw()
   def reset_polygon(self):
      self.points = []
      if self.polygon:
         self.polygon.remove()
         self.ax.figure.canvas.draw()
   def highlight_points_inside_polygon(self):
      if self.highlighted_points:
         for point in self.highlighted_points:
            point.set_markersize(5)
         self.highlighted_points = []
      if self.polygon:
         path = self.polygon.get_path()
         points_inside_polygon = self.ax.plot([], [], 'o', markersize=8, markerfacecolor='yellow')[0]
         for i in range(len(self.ax.collections)):
            if isinstance(self.ax.collections[i], PickEvent):
               xs, ys = self.ax.collections[i].get_offsets().T
               points_inside = path.contains_points(np.column_stack((xs, ys)))
               self.highlighted_points.extend(
                  self.ax.plot(
                     xs[points_inside], ys[points_inside], 'o', markersize=8, markerfacecolor='yellow'))
               self.ax.figure.canvas.draw()

# 使用随机数据创建散点图
np.random.seed(42)
x_data = np.random.rand(50)
y_data = np.random.rand(50)
fig, ax = plt.subplots()
ax.scatter(x_data, y_data)
# 初始化 PolygonSelector
polygon_selector = PolygonSelector(ax)
plt.show()
输出
示例 - 填充多边形内的区域
在这个示例中,我们使用 matplotlib 库填充多边形内的区域。
import matplotlib.pyplot as plt
from matplotlib.collections import PatchCollection
from matplotlib.patches import Polygon
import numpy as np
plt.rcParams["figure.figsize"] = [7.50, 3.50]
plt.rcParams["figure.autolayout"] = True
fig, ax = plt.subplots(1)
polygon = Polygon(np.random.rand(6, 2), closed=True, alpha=1)
collection = PatchCollection([polygon])
ax.add_collection(collection)
plt.show()
输出
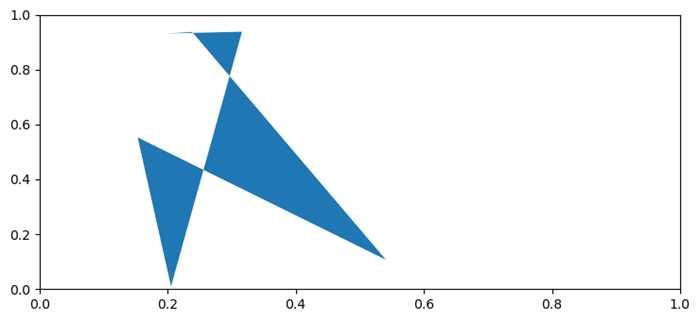
注意 − 要绘制图表上的多边形,请拖动光标,坐标值将根据用户选择而变化。