Matplotlib - 刻度定位器
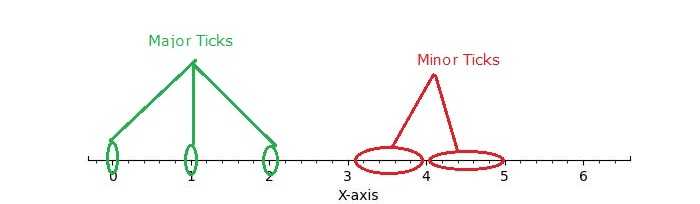
在一般的图表和绘图中,刻度 通过小线条在 x 轴和 y 轴上表示刻度尺度,提供与相关值清晰对应的指示。刻度定位器 则定义了这些刻度在轴上的位置,提供刻度尺度的视觉表示。
下图展示了图表上的主刻度和次刻度 −
Matplotlib 中的刻度定位器
Matplotlib 通过其 tick locators 提供了一种机制来控制轴上刻度的位置。matplotlib.ticker 模块包含用于配置刻度定位和格式化的 class。这些 class 包括通用的刻度定位器、Formatters 以及特定领域的自定义定位器。虽然定位器不区分主刻度和次刻度,但它们被 Axis class 用于支持主刻度和次刻度的定位和格式化。
不同的刻度定位器
matplotlib 在其 ticker 模块中提供了不同的 tick locator,允许用户自定义轴上的刻度位置。其中一些 Tick Locators 包括 −
- AutoLocator
- MaxNLocator
- LinearLocator
- LogLocator
- MultipleLocator
- FixedLocator
- IndexLocator
- NullLocator
- SymmetricalLogLocator
- AsinhLocator
- LogitLocator
- AutoMinorLocator
- 定义自定义定位器
基本设置
在深入探讨特定的刻度定位器之前,让我们先建立一个通用的设置函数来绘制带有刻度的图表。
import matplotlib.pyplot as plt
import numpy as np
import matplotlib.ticker as ticker

def draw_ticks(ax, title):
   # 只显示底部脊线
   ax.yaxis.set_major_locator(ticker.NullLocator())
   ax.spines[['left', 'right', 'top']].set_visible(False)

   ax.xaxis.set_ticks_position('bottom')
   ax.tick_params(which='major', width=1.00, length=5)
   ax.tick_params(which='minor', width=0.75, length=2.5)
   ax.set_xlim(0, 5)
   ax.set_ylim(0, 1)
   ax.text(0.0, 0.2, title, transform=ax.transAxes,
      fontsize=14, fontname='Monospace', color='tab:blue')
现在,让我们探索每个刻度定位器的工作原理。
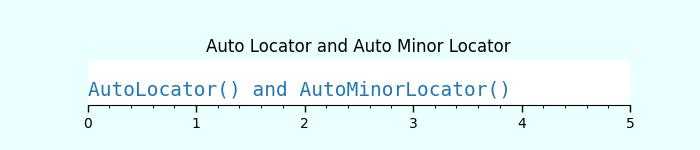
Auto Locator
AutoLocator 和 AutoMinorLocator 分别用于自动确定轴上主刻度和次刻度的位置。
示例 - 使用 Auto Locators
此示例演示了如何使用 AutoLocator 和 AutoMinorLocator 来自动处理轴上主刻度和次刻度的位置。
import matplotlib.pyplot as plt
import numpy as np
import matplotlib.ticker as ticker

def draw_ticks(ax, title):
   # 只显示底部脊线
   ax.yaxis.set_major_locator(ticker.NullLocator())
   ax.spines[['left', 'right', 'top']].set_visible(False)

   ax.xaxis.set_ticks_position('bottom')
   ax.tick_params(which='major', width=1.00, length=5)
   ax.tick_params(which='minor', width=0.75, length=2.5)
   ax.set_xlim(0, 5)
   ax.set_ylim(0, 1)
   ax.text(0.0, 0.2, title, transform=ax.transAxes,
      fontsize=14, fontname='Monospace', color='tab:blue')

# Auto Locator
fig, ax = plt.subplots(1,1,figsize=(7,1.5), facecolor='#eaffff')
plt.subplots_adjust(bottom=0.3, top=0.6, wspace=0.2, hspace=0.4)
draw_ticks(ax, title="AutoLocator() and AutoMinorLocator()")
ax.xaxis.set_major_locator(ticker.AutoLocator())
ax.xaxis.set_minor_locator(ticker.AutoMinorLocator())
ax.set_title('Auto Locator and Auto Minor Locator')
plt.show()
输出
Null Locator
NullLocator 在轴上不放置任何刻度线。
示例 - 使用 Null Locator
让我们看以下示例来了解 NullLocator 的工作原理。
import matplotlib.pyplot as plt
import numpy as np
import matplotlib.ticker as ticker

def draw_ticks(ax, title):
   # 只显示底部脊线
   ax.yaxis.set_major_locator(ticker.NullLocator())
   ax.spines[['left', 'right', 'top']].set_visible(False)

   ax.xaxis.set_ticks_position('bottom')
   ax.tick_params(which='major', width=1.00, length=5)
   ax.tick_params(which='minor', width=0.75, length=2.5)
   ax.set_xlim(0, 5)
   ax.set_ylim(0, 1)
   ax.text(0.0, 0.2, title, transform=ax.transAxes,
      fontsize=14, fontname='Monospace', color='tab:blue')

# Null Locator
fig, ax = plt.subplots(1,1,figsize=(7,1.5), facecolor='#eaffff')
plt.subplots_adjust(bottom=0.3, top=0.6, wspace=0.2, hspace=0.4)
draw_ticks(ax, title="NullLocator()")
ax.xaxis.set_major_locator(ticker.NullLocator())
ax.xaxis.set_minor_locator(ticker.NullLocator())
ax.set_title('Null Locator (No ticks)')
plt.show()
输出

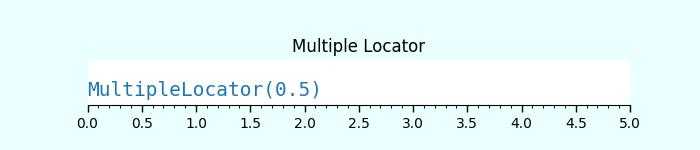
Multiple Locator
MultipleLocator() class 允许在指定基数的倍数位置放置刻度线,支持整数和浮点数值。
示例 - 使用 Multiple Locators
以下示例演示了如何使用 MultipleLocator() class。
import matplotlib.pyplot as plt
import numpy as np
import matplotlib.ticker as ticker

def draw_ticks(ax, title):
   # 只显示底部脊线
   ax.yaxis.set_major_locator(ticker.NullLocator())
   ax.spines[['left', 'right', 'top']].set_visible(False)

   ax.xaxis.set_ticks_position('bottom')
   ax.tick_params(which='major', width=1.00, length=5)
   ax.tick_params(which='minor', width=0.75, length=2.5)
   ax.set_xlim(0, 5)
   ax.set_ylim(0, 1)
   ax.text(0.0, 0.2, title, transform=ax.transAxes,
      fontsize=14, fontname='Monospace', color='tab:blue')

# Multiple Locator
fig, ax = plt.subplots(1,1,figsize=(7,1.5), facecolor='#eaffff')
plt.subplots_adjust(bottom=0.3, top=0.6, wspace=0.2, hspace=0.4)
draw_ticks(ax, title="MultipleLocator(0.5)")
ax.xaxis.set_major_locator(ticker.MultipleLocator(0.5))
ax.xaxis.set_minor_locator(ticker.MultipleLocator(0.1))
ax.set_title('Multiple Locator')
plt.show()
输出
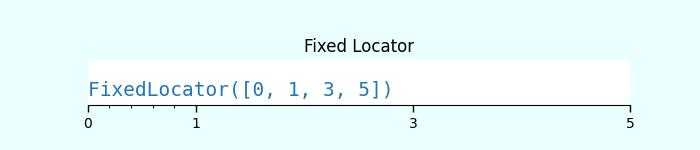
Fixed Locator
FixedLocator() 在指定的固定位置放置刻度线。
示例 - 使用 Fixed Locator
以下是使用 FixedLocator() class 的示例。
import matplotlib.pyplot as plt
import numpy as np
import matplotlib.ticker as ticker

def draw_ticks(ax, title):
   # 只显示底部脊线
   ax.yaxis.set_major_locator(ticker.NullLocator())
   ax.spines[['left', 'right', 'top']].set_visible(False)

   ax.xaxis.set_ticks_position('bottom')
   ax.tick_params(which='major', width=1.00, length=5)
   ax.tick_params(which='minor', width=0.75, length=2.5)
   ax.set_xlim(0, 5)
   ax.set_ylim(0, 1)
   ax.text(0.0, 0.2, title, transform=ax.transAxes,
      fontsize=14, fontname='Monospace', color='tab:blue')

# Fixed Locator
fig, ax = plt.subplots(1,1,figsize=(7,1.5), facecolor='#eaffff')
plt.subplots_adjust(bottom=0.3, top=0.6, wspace=0.2, hspace=0.4)
draw_ticks(ax, title="FixedLocator([0, 1, 3, 5])")
ax.xaxis.set_major_locator(ticker.FixedLocator([0, 1, 3, 5]))
ax.xaxis.set_minor_locator(ticker.FixedLocator(np.linspace(0.2, 0.8, 4)))
ax.set_title('Fixed Locator')
plt.show()
输出
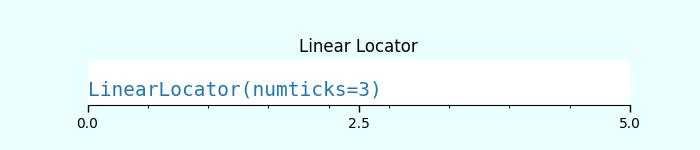
Linear Locator
LinearLocator 在指定的最小值和最大值之间均匀分布刻度。
示例 - 使用 Linear Locator
这是一个将 LinearLocator 应用于坐标轴主刻度和次刻度的示例。
import matplotlib.pyplot as plt
import numpy as np
import matplotlib.ticker as ticker

def draw_ticks(ax, title):
   # 只显示底部脊线
   ax.yaxis.set_major_locator(ticker.NullLocator())
   ax.spines[['left', 'right', 'top']].set_visible(False)

   ax.xaxis.set_ticks_position('bottom')
   ax.tick_params(which='major', width=1.00, length=5)
   ax.tick_params(which='minor', width=0.75, length=2.5)
   ax.set_xlim(0, 5)
   ax.set_ylim(0, 1)
   ax.text(0.0, 0.2, title, transform=ax.transAxes,
      fontsize=14, fontname='Monospace', color='tab:blue')

# Linear Locator
fig, ax = plt.subplots(1,1,figsize=(7,1.5), facecolor='#eaffff')
plt.subplots_adjust(bottom=0.3, top=0.6, wspace=0.2, hspace=0.4)
draw_ticks(ax, title="LinearLocator(numticks=3)")
ax.xaxis.set_major_locator(ticker.LinearLocator(3))
ax.xaxis.set_minor_locator(ticker.LinearLocator(10))
ax.set_title('Linear Locator')
plt.show()
输出
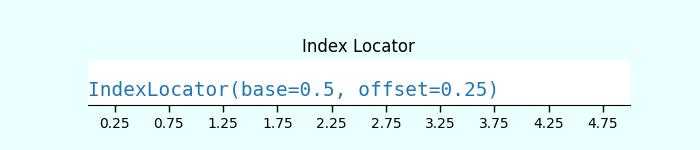
Index Locator
此定位器适用于索引图,其中 x = range(len(y))。
示例 - 使用 Index Locator
这是一个使用索引定位器(ticker.IndexLocator() 类)的示例。
import matplotlib.pyplot as plt
import numpy as np
import matplotlib.ticker as ticker

def draw_ticks(ax, title):
   # 只显示底部脊线
   ax.yaxis.set_major_locator(ticker.NullLocator())
   ax.spines[['left', 'right', 'top']].set_visible(False)

   ax.xaxis.set_ticks_position('bottom')
   ax.tick_params(which='major', width=1.00, length=5)
   ax.tick_params(which='minor', width=0.75, length=2.5)
   ax.set_xlim(0, 5)
   ax.set_ylim(0, 1)
   ax.text(0.0, 0.2, title, transform=ax.transAxes,
      fontsize=14, fontname='Monospace', color='tab:blue')

# Index Locator
fig, ax = plt.subplots(1,1,figsize=(7,1.5), facecolor='#eaffff')
plt.subplots_adjust(bottom=0.3, top=0.6, wspace=0.2, hspace=0.4)
draw_ticks(ax, title="IndexLocator(base=0.5, offset=0.25)")
ax.plot([0]*5, color='white')
ax.xaxis.set_major_locator(ticker.IndexLocator(base=0.5, offset=0.25))
ax.set_title('Index Locator')
plt.show()
输出
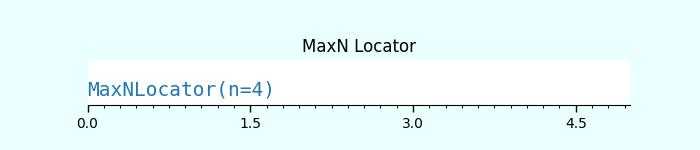
MaxN Locator
MaxNLocator 会在合适的刻度位置找到最多指定数量的间隔。
示例 - 使用 MaxN Locator
这是一个使用 MaxNLocator() 类同时设置主刻度和次刻度的示例。
import matplotlib.pyplot as plt
import numpy as np
import matplotlib.ticker as ticker

def draw_ticks(ax, title):
   # 只显示底部脊线
   ax.yaxis.set_major_locator(ticker.NullLocator())
   ax.spines[['left', 'right', 'top']].set_visible(False)

   ax.xaxis.set_ticks_position('bottom')
   ax.tick_params(which='major', width=1.00, length=5)
   ax.tick_params(which='minor', width=0.75, length=2.5)
   ax.set_xlim(0, 5)
   ax.set_ylim(0, 1)
   ax.text(0.0, 0.2, title, transform=ax.transAxes,
      fontsize=14, fontname='Monospace', color='tab:blue')

# MaxN Locator
fig, ax = plt.subplots(1,1,figsize=(7,1.5), facecolor='#eaffff')
plt.subplots_adjust(bottom=0.3, top=0.6, wspace=0.2, hspace=0.4)
draw_ticks(ax, title="MaxNLocator(n=4)")
ax.xaxis.set_major_locator(ticker.MaxNLocator(4))
ax.xaxis.set_minor_locator(ticker.MaxNLocator(40))
ax.set_title('MaxN Locator')
plt.show()
输出
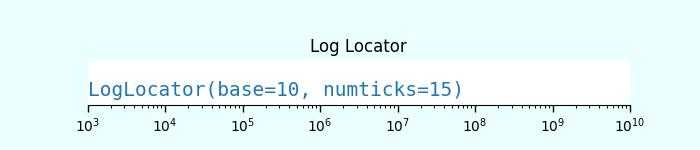
对数刻度定位器
LogLocator 用于以对数方式从最小值到最大值间距刻度。
示例 - 使用 Log Locator
让我们看一个使用 Log Locator 的示例。它在对数刻度上显示次要刻度标签。
import matplotlib.pyplot as plt
import numpy as np
import matplotlib.ticker as ticker

def draw_ticks(ax, title):
   # 只显示底部脊线
   ax.yaxis.set_major_locator(ticker.NullLocator())
   ax.spines[['left', 'right', 'top']].set_visible(False)

   ax.xaxis.set_ticks_position('bottom')
   ax.tick_params(which='major', width=1.00, length=5)
   ax.tick_params(which='minor', width=0.75, length=2.5)
   ax.set_xlim(0, 5)
   ax.set_ylim(0, 1)
   ax.text(0.0, 0.2, title, transform=ax.transAxes,
      fontsize=14, fontname='Monospace', color='tab:blue')

# Log Locator
fig, ax = plt.subplots(1,1,figsize=(7,1.5), facecolor='#eaffff')
plt.subplots_adjust(bottom=0.3, top=0.6, wspace=0.2, hspace=0.4)
draw_ticks(ax, title="LogLocator(base=10, numticks=15)")
ax.set_xlim(10**3, 10**10)
ax.set_xscale('log')
ax.xaxis.set_major_locator(ticker.LogLocator(base=10, numticks=15))
ax.set_title('Log Locator')
plt.show()
输出