Matplotlib - 样式
Matplotlib 中的 Style 是什么?
在 Matplotlib 库中,styles 是允许我们轻松改变图表视觉外观的配置。它们作为预定义的美学选择集,通过更改颜色、线条样式、字体、网格线等方面来实现。这些样式有助于快速自定义图表的整体外观,而无需每次手动调整各个元素。
我们可以尝试不同的样式,找到最适合我们数据或视觉偏好的样式。Styles 提供了在 Matplotlib 库中增强图表视觉呈现的快速高效方式。
内置样式
Matplotlib 提供了多种内置样式,这些样式提供不同的配色方案、线条样式、字体大小和其他视觉属性。
示例包括 ggplot, seaborn, classic, dark_background 等。
更改样式
使用 plt.style.use('style_name') 来为我们的图表应用特定样式。Matplotlib 样式的关键方面
预定义样式 − Matplotlib 库提供了各种内置样式,为我们的图表提供不同的美学效果。
易用性 − 通过应用样式,我们可以立即改变图表的整体外观,以匹配不同的主题或视觉偏好。
一致性 − 样式确保在同一样式设置下多个图表或图形之间的一致性。
使用样式
在 Matplotlib 库中使用可用样式涉及几个步骤。我们逐一来看。
设置样式
要设置所需的样式,我们必须在使用 plt.style.use('style_name') 创建图表之前设置特定样式。
例如,如果我们想设置 ggplot 样式,则需要使用下面的代码。
import matplotlib.pyplot as plt
plt.style.use('ggplot')  # 设置 'ggplot' 样式
可用样式
我们可以使用 plt.style.available 查看可用样式的列表。
示例
import matplotlib.pyplot as plt
print(plt.style.available)  # 打印可用样式
输出
['Solarize_Light2', '_classic_test_patch', '_mpl-gallery', '_mpl-gallery-nogrid', 'bmh', 'classic', 'dark_background', 'fast', 'fivethirtyeight', 'ggplot', 'grayscale', 'seaborn', 'seaborn-bright', 'seaborn-colorblind', 'seaborn-dark', 'seaborn-dark-palette', 'seaborn-darkgrid', 'seaborn-deep', 'seaborn-muted', 'seaborn-notebook', 'seaborn-paper', 'seaborn-pastel', 'seaborn-poster', 'seaborn-talk', 'seaborn-ticks', 'seaborn-white', 'seaborn-whitegrid', 'tableau-colorblind10']
应用自定义样式
我们可以创建具有特定配置的自定义样式文件,然后使用 plt.style.use('path_to_custom_style_file') 来应用它们。
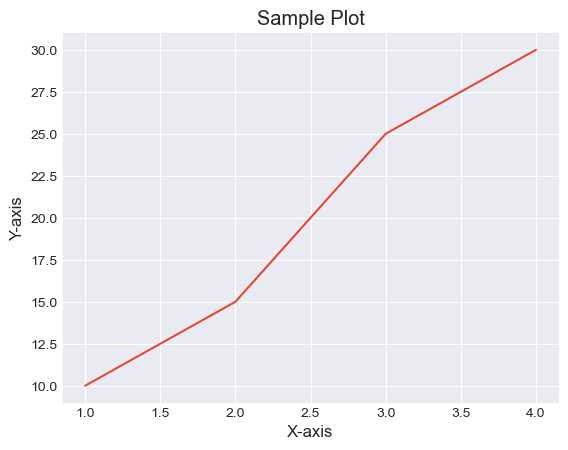
示例 - 应用 seaborn-darkgrid 样式
在这个示例中,样式 'seaborn-darkgrid' 被应用到图表上,改变了其外观。
import matplotlib.pyplot as plt
# 使用特定样式
plt.style.use('seaborn-darkgrid')

# 创建示例图表
plt.plot([1, 2, 3, 4], [10, 15, 25, 30])
plt.xlabel('X-axis')
plt.ylabel('Y-axis')
plt.title('Sample Plot')
plt.show()
输出
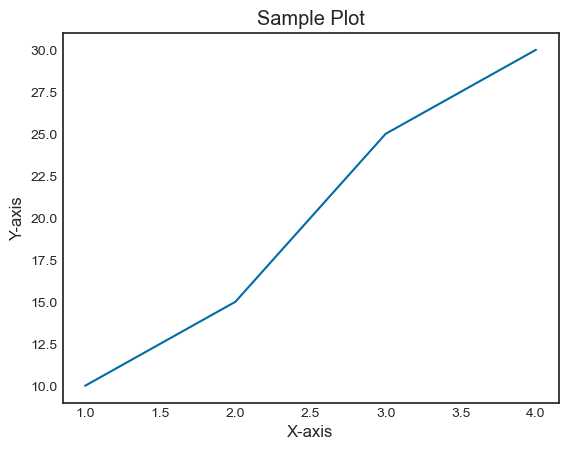
示例 - 应用 ggplot 样式
在这个示例中,我们为图表使用了 ggplot 样式。
import matplotlib.pyplot as plt
# 使用特定样式
plt.style.use('seaborn-white')

# 创建示例图表
plt.plot([1, 2, 3, 4], [10, 15, 25, 30])
plt.xlabel('X-axis')
plt.ylabel('Y-axis')
plt.title('Sample Plot')
plt.show()
输出