Matplotlib - Cursor Widget
什么是 Cursor Widget?
Matplotlib 的 Cursor Widget 特指 Matplotlib 的 widgets 模块中的 Cursor class。它提供了一种交互式显示绘图坐标和数据值的方法,随着光标在绘图上移动而实时更新。此功能特别适用于探索数据点或交互式获取绘图中的特定信息。
Cursor Widget 的主要特性
以下是 matplotlb 库的 cursor widget 的主要特性。
交互式光标 − Cursor class 创建一个交互式光标,它会跟踪鼠标指针在 Matplotlib 绘图上的移动位置。
坐标显示 − 当光标悬停在绘图上时,该 widget 会显示对应光标位置的 x 和 y 数据坐标。
数据值显示 − 我们可以可选地配置光标以显示光标位置的数据值或其他相关信息,这对于可视化特定数据点非常有用。
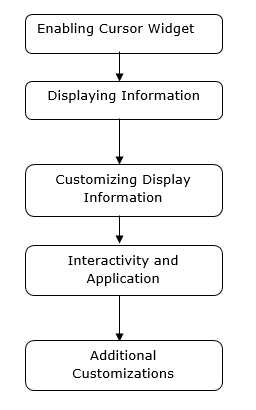
使用 Cursor Widget 的基本工作流程
以下是 cursor widget 使用的基本流程图。
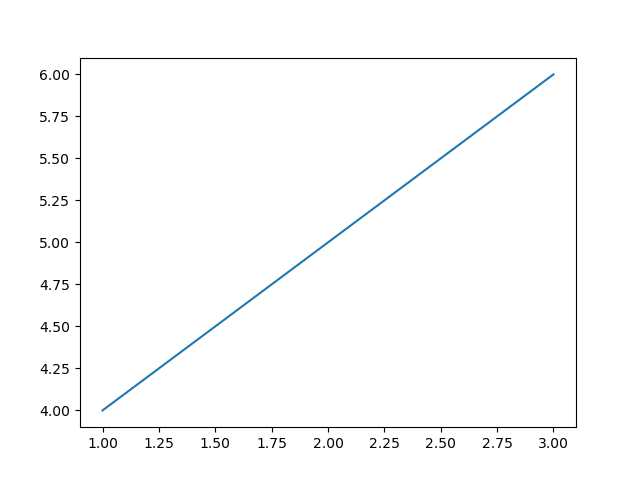
示例 - 启用 Cursor Widget
在 Matplotlib 中启用 cursor widget 需要使用 plt.connect() 将一个 function 连接到 'motion_notify_event',以处理光标在图表上的移动。
这种设置允许我们在将光标移动到图表上时,在控制台中交互式地查看光标的坐标。我们可以根据具体需求修改 on_move() function 来执行其他操作或以不同方式显示信息。
在这个示例中,on_move() 是一个处理光标移动事件的 function。它检查光标是否在图表区域内 event.inaxes,并获取光标的 x 和 y 坐标 event.xdata 和 event.ydata。plt.connect('motion_notify_event', on_move) 将 'motion_notify_event' 连接到 on_move() function,从而启用 cursor widget。当光标在图表上移动时,on_move() function 会被触发。
import matplotlib.pyplot as plt
# 处理光标移动的函数
def on_move(event):
   if event.inaxes:  # 检查光标是否在图表区域内
      x, y = event.xdata, event.ydata  # 获取光标位置
      print(f'Cursor at x={x:.2f}, y={y:.2f}')  # 显示坐标
# 创建图表
fig, ax = plt.subplots()
ax.plot([1, 2, 3], [4, 5, 6])
# 将 'motion_notify_event' 连接到 on_move 函数
plt.connect('motion_notify_event', on_move)
plt.show()
输出
示例 - 显示信息
在 Matplotlib 中使用自定义 widget 显示信息,可以创建带有自定义元素的交互式图表,以展示特定信息或增强用户交互。让我们创建一个简单的示例。在这个示例中,我们将频率设置为 45。
import matplotlib.pyplot as plt
from matplotlib.widgets import TextBox, Button
import numpy as np
# 生成示例数据
x = np.linspace(0, 10, 100)
y = np.sin(x)
# 创建图表
fig, ax = plt.subplots()
line, = ax.plot(x, y)
# 根据输入更新图表的函数
def update(text):
   frequency = float(text)  # 从输入获取频率值
   new_y = np.sin(frequency * x)  # 根据频率生成新的 y 值
   line.set_ydata(new_y)  # 更新图表
   ax.set_title(f'Sine Wave with Frequency={frequency:.2f}')  # 更新图表标题
   fig.canvas.draw_idle()  # 重新绘制图表
# 创建用于输入的文本框 widget
text_box = TextBox(plt.axes([0.1, 0.9, 0.1, 0.075]), 'Frequency')
text_box.on_submit(update)  # 将文本框连接到更新函数
# 显示图表
plt.show()
输出

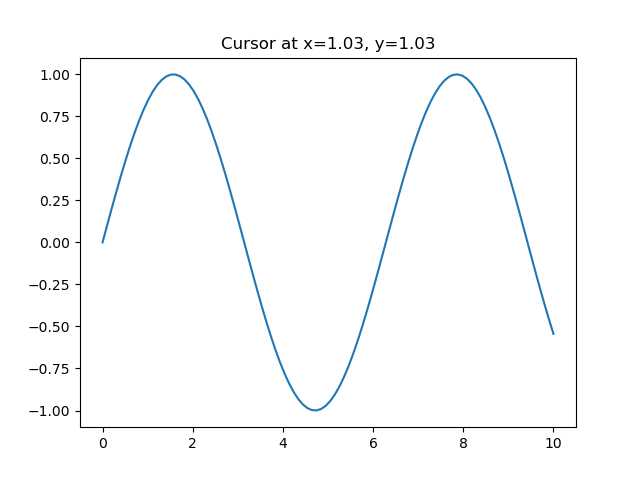
示例 - 自定义显示信息
在使用 Matplotlib 的 cursor widget 时,我们可以根据光标在图表上的位置自定义显示的信息。以下是一个实现示例。
import matplotlib.pyplot as plt
import numpy as np
# 生成示例数据
x = np.linspace(0, 10, 100)
y = np.sin(x)
# 创建图表
fig, ax = plt.subplots()
line, = ax.plot(x, y)
# 根据光标位置更新显示信息的函数
def update_cursor_info(event):
   if event.inaxes:
      x_cursor, y_cursor = event.xdata, event.ydata
      ax.set_title(f'Cursor at x={x_cursor:.2f}, y={y_cursor:.2f}')
      fig.canvas.draw_idle()
# 将 'motion_notify_event' 连接到 update_cursor_info 函数
plt.connect('motion_notify_event', update_cursor_info)
plt.show()
输出
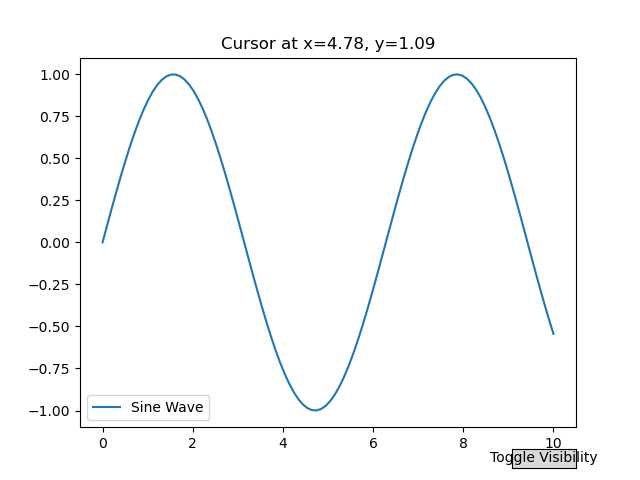
示例 - 交互性和应用
cursor widget 的交互性为增强用户与图表的互动提供了强大方式。通过使用 cursor widget,用户可以交互式地探索数据点并获得洞察。让我们增强前面的示例来演示交互性和潜在应用。
import matplotlib.pyplot as plt
import numpy as np
# 生成示例数据
x = np.linspace(0, 10, 100)
y = np.sin(x)
# 创建图表
fig, ax = plt.subplots()
line, = ax.plot(x, y, label='Sine Wave')
# 根据光标位置更新显示信息的函数
def update_cursor_info(event):
   if event.inaxes:
      x_cursor, y_cursor = event.xdata, event.ydata
      ax.set_title(f'Cursor at x={x_cursor:.2f}, y={y_cursor:.2f}')
      fig.canvas.draw_idle()
# 将 'motion_notify_event' 连接到 update_cursor_info 函数
plt.connect('motion_notify_event', update_cursor_info)
# 添加图例
ax.legend()
# 添加按钮以切换正弦波的可见性,实现交互性
def toggle_visibility(event):
   current_visibility = line.get_visible()
   line.set_visible(not current_visibility)
   ax.legend().set_visible(not current_visibility)
   fig.canvas.draw_idle()
# 创建按钮 widget
button_ax = plt.axes([0.8, 0.025, 0.1, 0.04])
toggle_button = plt.Button(button_ax, 'Toggle Visibility')
toggle_button.on_clicked(toggle_visibility)
plt.show()
输出
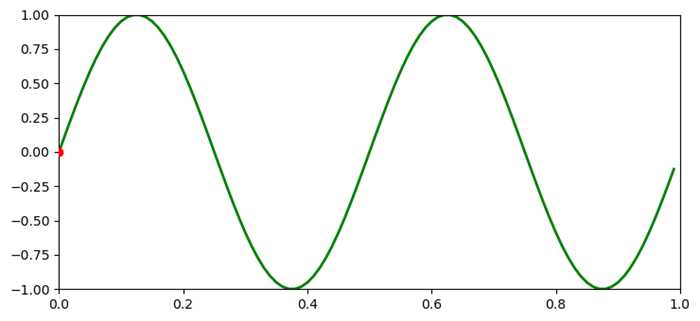
示例 - 为曲线添加光标
在这个示例中,我们在 Matplotlib 中为曲线添加一个光标
import matplotlib.pyplot as plt
import numpy as np

plt.rcParams["figure.figsize"] = [7.50, 3.50]
plt.rcParams["figure.autolayout"] = True

class CursorClass(object):
   def __init__(self, ax, x, y):
      self.ax = ax
      self.ly = ax.axvline(color='yellow', alpha=0.5)
      self.marker, = ax.plot([0], [0], marker="o", color="red", zorder=3)
      self.x = x
      self.y = y
      self.txt = ax.text(0.7, 0.9, '')

   def mouse_event(self, event):
      if event.inaxes:
         x, y = event.xdata, event.ydata
         indx = np.searchsorted(self.x, [x])[0]
         x = self.x[indx]
         y = self.y[indx]
         self.ly.set_xdata(x)
         self.marker.set_data([x], [y])
         self.txt.set_text('x=%1.2f, y=%1.2f' % (x, y))
         self.txt.set_position((x, y))
         self.ax.figure.canvas.draw_idle()
      else:
         return

t = np.arange(0.0, 1.0, 0.01)
s = np.sin(2 * 2 * np.pi * t)

fig, ax = plt.subplots()

cursor = CursorClass(ax, t, s)
cid = plt.connect('motion_notify_event', cursor.mouse_event)

ax.plot(t, s, lw=2, color='green')
plt.axis([0, 1, -1, 1])

plt.show()
输出