Matplotlib - Button Widget
什么是 Button Widget?
在 Matplotlib 库中,Buttons widget 允许在图表或图形中创建交互式按钮。这些按钮在被点击时可以触发特定的动作或函数,为用户提供一种直观的方式来控制图表元素或执行操作,而无需编写额外的代码。
Button Widget 的关键特性
交互式界面 − 按钮在图表中提供用户友好的界面,通过增强交互性来帮助用户探索数据。
函数触发 − 每个按钮都关联一个特定的函数或动作,当按钮被点击时执行该函数。
自定义 − 按钮可以根据特定应用需求自定义外观、位置、标签和功能。
Matplotlib 库中的 Button widget 位于 matplotlib.widgets 模块中。这允许用户直接将交互式按钮集成到图表中。这些按钮在被点击时可以触发特定动作或函数,从而为可视化添加交互性和控制功能。
Button Widget 的基本用法
以下是 Matplotlib 库中 Button widget 的使用方法分解,我们逐一来看。
导入必要的库
要在 Matplotlib 中使用 Button widget,我们需要从 Matplotlib 导入必要的模块。以下是如何导入使用 button widget 所需的库的方法。
import matplotlib.pyplot as plt
from matplotlib.widgets import Button
其中,
matplotlib.pyplot − 该模块在 Matplotlib 中提供类似于 MATLAB 的绘图框架。通常导入为 plt,并提供创建 figure、axes、plot 和 plot 内 widget 的函数。
matplotlib.widgets.Button − Button class 是 matplotlib.widgets 模块的一部分,该模块包含各种交互式 widget,如 button。从该模块导入 Button 可以让我们在 plot 中创建和自定义 button。
导入这些库后,我们就可以在 Matplotlib plot 中创建 button 并定义其功能。Button widget 集成到 plot 中后,可以提供交互元素,用于在用户交互时触发特定动作或函数。
示例 - 创建 Figure 和 Axes
在 Matplotlib 中创建 figure 和 axes 涉及设置画布(figure)和绘图区域(axes),您的可视化内容将在此显示。以下是创建 figure 和 axes 的示例。
import matplotlib.pyplot as plt
# Create a figure and axes
fig, ax = plt.subplots()
# Plotting on the axes
ax.plot([1, 2, 3], [4, 5, 6])
# Show the plot
plt.show()
输出

示例 - 定义 Button 点击功能
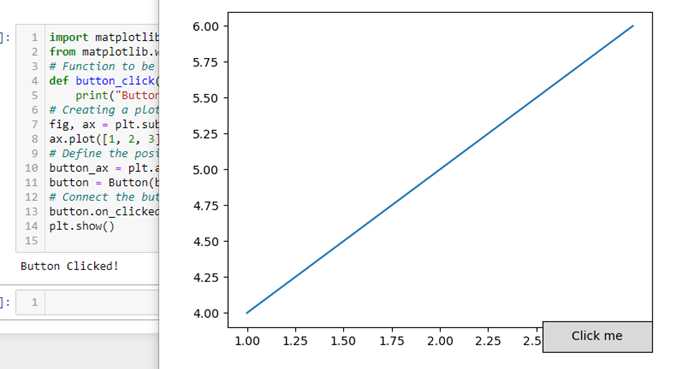
在 Matplotlib 中为 button 定义功能涉及创建一个函数,该函数指定 button 被点击时要执行的动作。以下是为 button 点击定义功能的示例。
import matplotlib.pyplot as plt
from matplotlib.widgets import Button
# Function to be triggered by the button click
def button_click(event):
   print("Button Clicked!")  # 在此处执行动作或调用函数
# Creating a plot
fig, ax = plt.subplots()
ax.plot([1, 2, 3], [4, 5, 6])
# Define the position and dimensions of the button
button_ax = plt.axes([0.7, 0.05, 0.2, 0.075])  # [left, bottom, width, height]
button = Button(button_ax, 'Click me')  # Create a button object
# Connect the button's click event to the function
button.on_clicked(button_click)
plt.show()
输出
示例 - 创建 Button
使用 matplotlib.widgets 模块中的 Button class 创建 button 对象,并在 plot 中定义其位置和尺寸。以下是演示如何创建 button 的示例。
import matplotlib.pyplot as plt
from matplotlib.widgets import Button
# Function to be triggered by the button click
def button_click(event):
   print("Button Clicked!")  # 在此处执行动作或调用函数
# Creating a figure and axes
fig, ax = plt.subplots()
# Define the position and dimensions of the button
button_ax = plt.axes([0.5, 0.5, 0.12, 0.15])  # [left, bottom, width, height]
# Create a button object
button = Button(button_ax, 'Click me')  # 'Click me' is the text displayed on the button
# Connect the button's click event to the function
button.on_clicked(button_click)
# Show the plot
plt.show()
输出

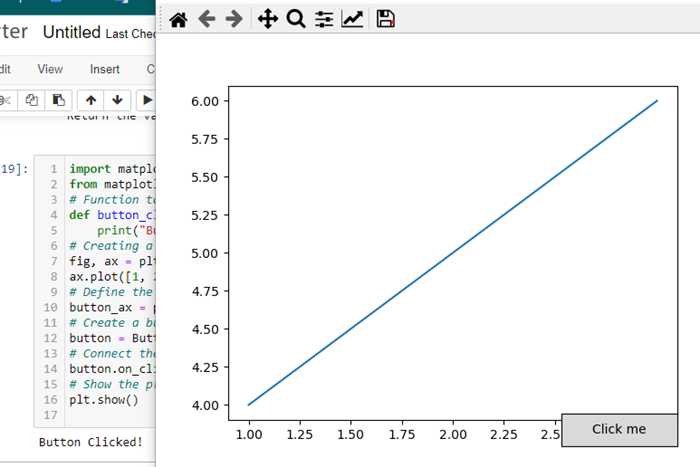
现在运行这段代码并显示 plot 时,我们将看到一个标记为 'Click me' 的 button。点击该 button 将触发 button_click 函数,并在控制台打印 "Button Clicked!"。我们可以根据具体需求自定义 `button_click` 函数来执行不同的动作。
示例 - 连接 Button 点击事件
将 button 的点击事件连接到函数涉及使用 Matplotlib 中 Button widget 提供的 on_clicked 方法。以下是演示如何将 button 的点击事件连接到函数的示例。
import matplotlib.pyplot as plt
from matplotlib.widgets import Button
# Function to be triggered by the button click
def button_click(event):
   print("Button Clicked!")  # 在此处执行动作或调用函数
# Creating a figure and axes
fig, ax = plt.subplots()
ax.plot([1, 2, 3], [4, 5, 6])
# Define the position and dimensions of the button
button_ax = plt.axes([0.7, 0.05, 0.2, 0.075])  # [left, bottom, width, height]
# Create a button object
button = Button(button_ax, 'Click me')  # 'Click me' is the text displayed on the button
# Connect the button's click event to the function
button.on_clicked(button_click)
# Show the plot
plt.show()
输出
自定义和功能
位置和大小 − 使用 [left, bottom, width, height] 坐标调整 button 的位置和大小。
Button 文本 − 指定 button 上显示的文本。
Button 动作 − 定义 button 被点击时执行的函数。这可以包括更新 plot、计算新数据或触发其他事件等动作。
Button widget 通过允许用户直接从 plot 界面触发动作或函数,为 Matplotlib plot 提供交互元素。它对于控制各种功能或执行与可视化相关的特定任务非常有用。